How Does Shazam Work ?
What is Shazam, you may ask? Let’s say you’re in a bar, and they play a song that you like and you don’t know its name. Shazam can help you find out what is the name of that song.
What Shazam does, is it lets you record up to 15 seconds of the song you are hearing and then it will tell you everything you want to know about that song: the artist, the name of the song, the album, offers you links to YouTube, to buy the song on iTunes, you name it.
Shazam was first offered in the UK as a phone service over the GSM network, but now it’s available worldwide on smartphones. But this is not the best part of the app. What is the most amazing thing, is the conditions in which it can detect the song it “hears”: it can detect the song recorded in heavy background noise conditions (like a crowded bar, as I initially mentioned) and even when the recorded sound quality is very low (it can run over cellular phone network). It is so amazing, that it can distinguish a song when 2 songs are playing simultaneously or when the song is in the background of a radio DJ.
So, how does it manage to do this? Avery Li-Chun Wang, the chief scientist and co-founder of Shazam, published a paper that explains just that. In a few words, it has a database of song fingerprints generated out of their spectrograms. When you record a sample with their app, they will generate a fingerprint for the recorded sample in the same way they did for all the songs in their database. After that, they will try to find a match in their database for the sample.
In the next lines, I will try to explain in simple terms what I understood from that paper.
How to fingerprint a song
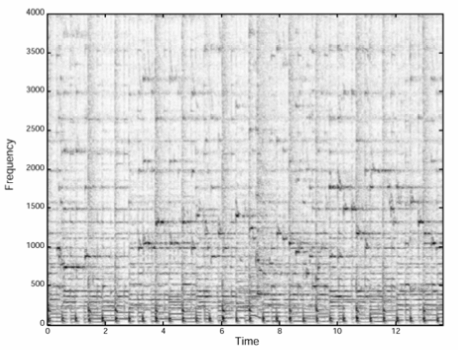
First, they generate a spectrogram for the song. The spectrogram is a 3 dimensions graph. On the horizontal (X) axis, you have the time. On the vertical (Y) axis you have the frequency. The third dimension is represented by the color intensity and it denotes the amplitude of a certain frequency.
Basically, a dot on the graph will represent the volume of a certain sound at a certain time in the song. A darker point means that the specific sound is louder than a lighter point.
Storing the full song in the database will occupy an enormous amount of space, considering that the Shazam database has more than 8 million songs. So instead, they will store only the intense sounds in the song, the time when they appear in the song and at which frequency.
So a spectrogram for a song will be transformed from this:
into this:
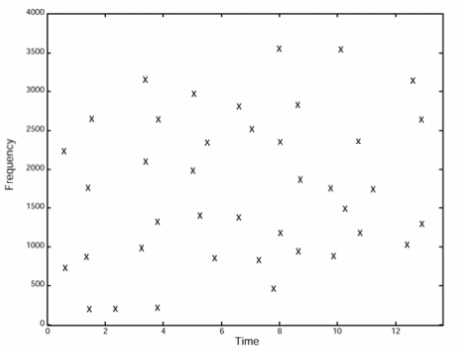
Note that the darker spots in the spectrogram match the crosses in the second image.
To store this in the database in a way that is efficient to search for a match (easy to index), they choose some of the points from within the simplified spectrogram, called anchor points and zones in the vicinity of them, called target zone.
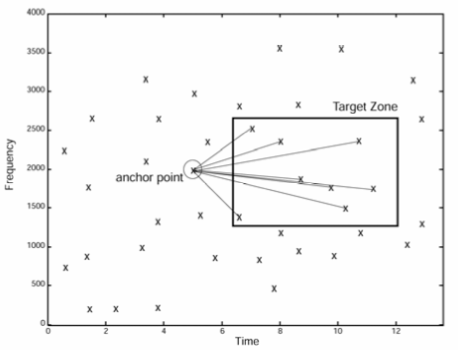
Now, for each point in the target zone, they will create a hash that will be the aggregation of the following: the frequency at which the anchor point is located (f1) + the frequency at which the point in the target zone is located (f2)+ the time difference between the time when the point in the target zone is located in the song (t2) and the time when the anchor point is located in the song (t1) + t1. To simplify: hash = (f1+f2+(t2-t1))+t1
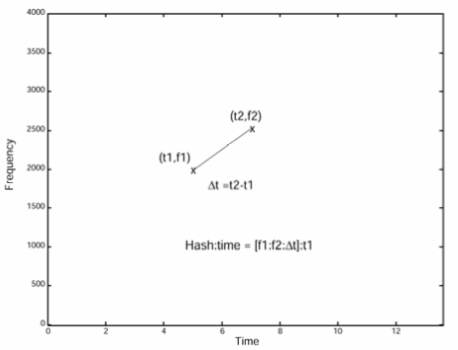
A hash function is any function that can be used to map data of arbitrary size to fixed-size values. The values returned by a hash function are called hash values, hash codes, digests, or simply hashes.
After this, they will store each hash generated like this in the database.
Detecting the song
They first repeat the same fingerprinting also to the recorded sample. Each hash generated from the sample sound will be searched for a match in the database.
If a match is found, you will have the time of the hash from the sample (th1), the time of the hash from the song in the database (th2) and implicitly the ID of the song for which the hash matched. Basically, th1 is the time from the beginning of the sample until the time of the sample hash, and th2 is the time since the beginning of the song and the time of the song hash.
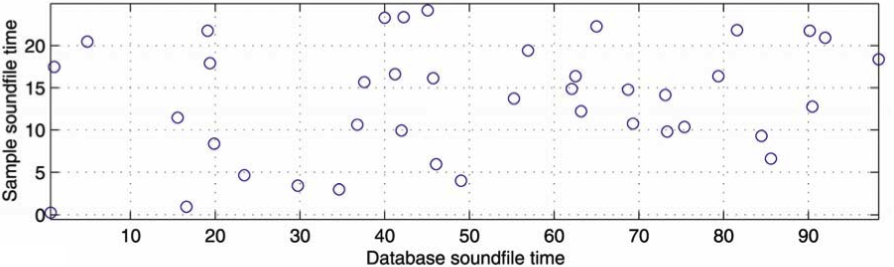
Now, they will draw a new graph called a scatter graph. The graph will have on the horizontal axis (X) the time of the song in the database and on the vertical axis (Y) the time of the recorded sample. On the X axis, we will mark th2 and on the Y axis, we will mark th1. The point of intersection of the two occurrence times will be marked with a small circle.
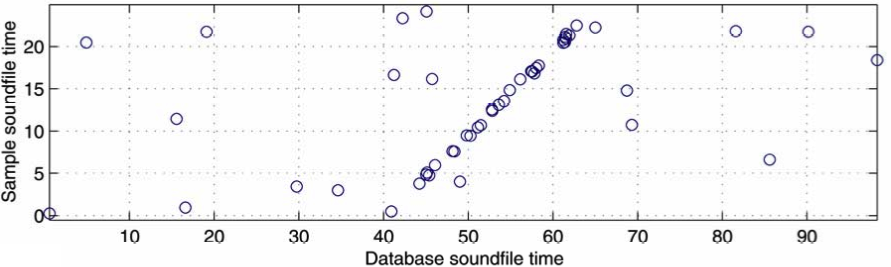
The magic happens now: if the graph will contain a lot of pairs of th1s and th2s from the same song, a diagonal line will form. The idea behind the formation of that line is simple: the rate at which the peaks (the small crosses from the simplified spectrogram) in the database song appear will be the same rate at which the peaks appear in the recorded sample, so if you pair these times, the coordinates on the scatter graph will grow constantly (to the right-top of the graph) as the time passes on both axes.
Here is how a scatter graph will look for a non-matching run
versus how it will look for a matching run
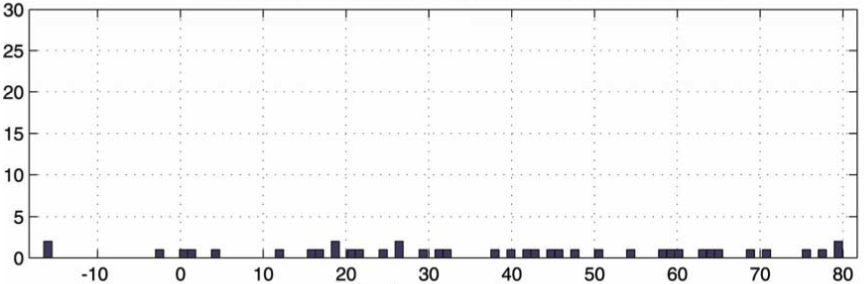
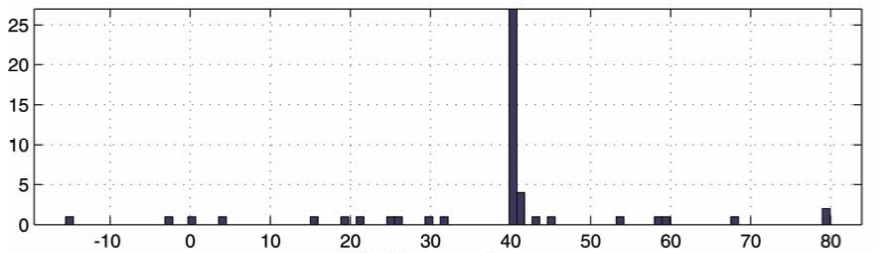
Finally, they will calculate the difference between th2 and th1 (dth) and they will plot it in a histogram. If there is a match in the graph plotted, then there will be a lot of dths with the same value, because, subtracting the th2 from th1 will give you the offset from where the sample was recorded (the difference between a point in the original song and the same point in the recorded sample). This will result in a peak within the histogram, which will confirm a match.
A histogram is an approximate representation of the distribution of numerical data.
Here is how a histogram for a non-matching run will look like
versus a histogram for a matching run
That's pretty much all the info I could get from the paper. If I missed something or you have other interesting facts about this, please let me know in the comments.
Hope it helps 😉